Filters
Parameter to Change Views
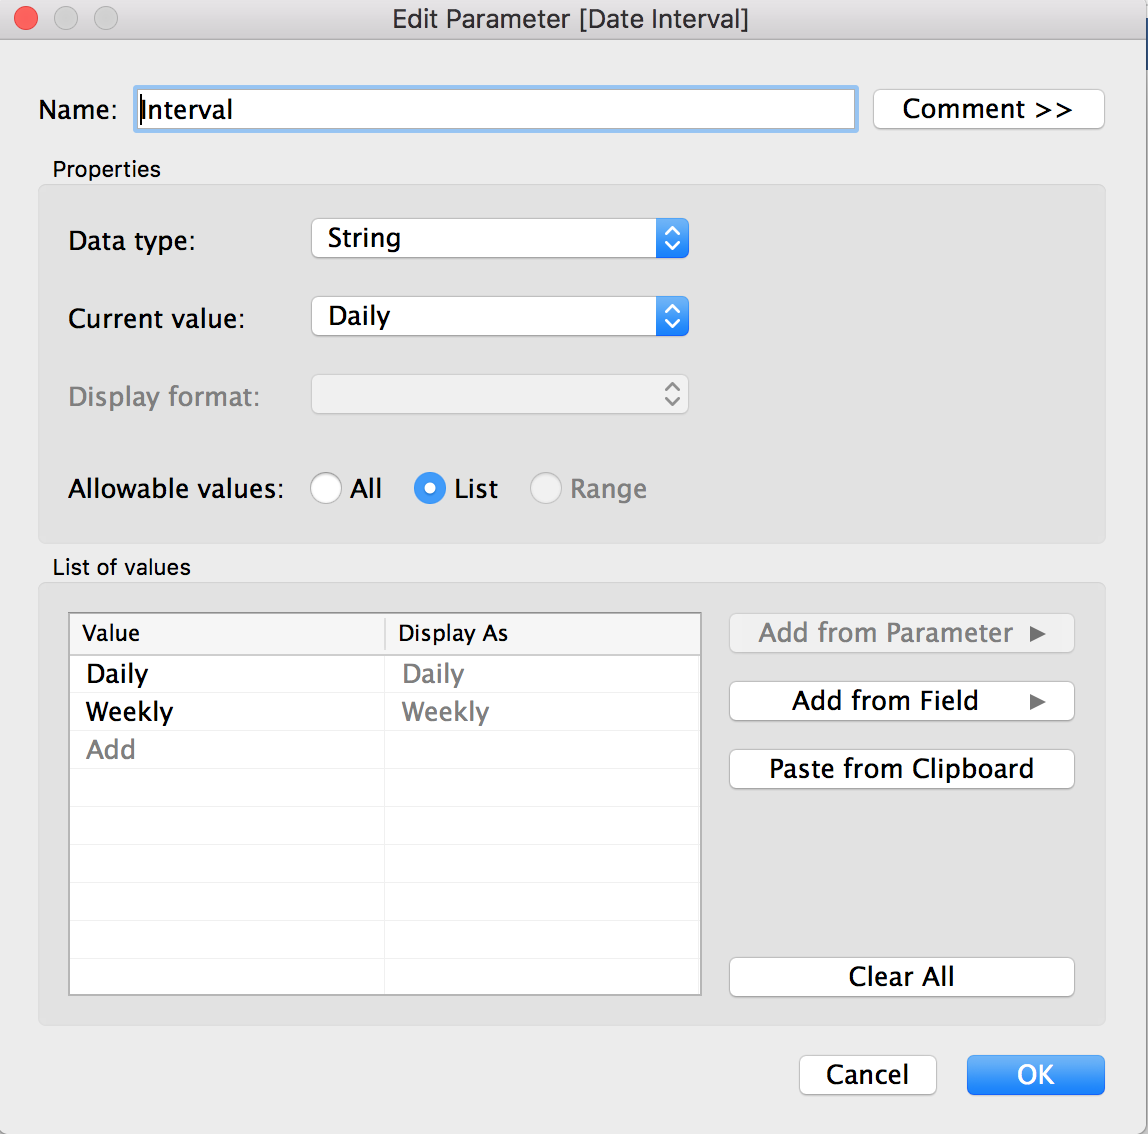
To swap two or more charts based on a filter, a parameter needs to be created with the possible selectors. Here is an example of two views using daily and weekly bar chart.
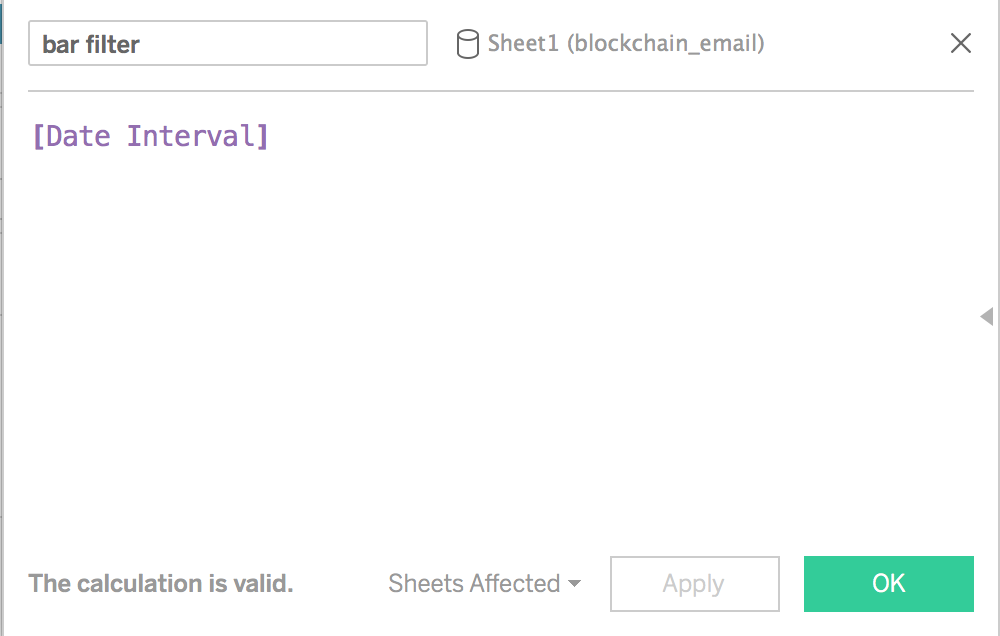
Then, we create one calculated field and dump the parameter field in.
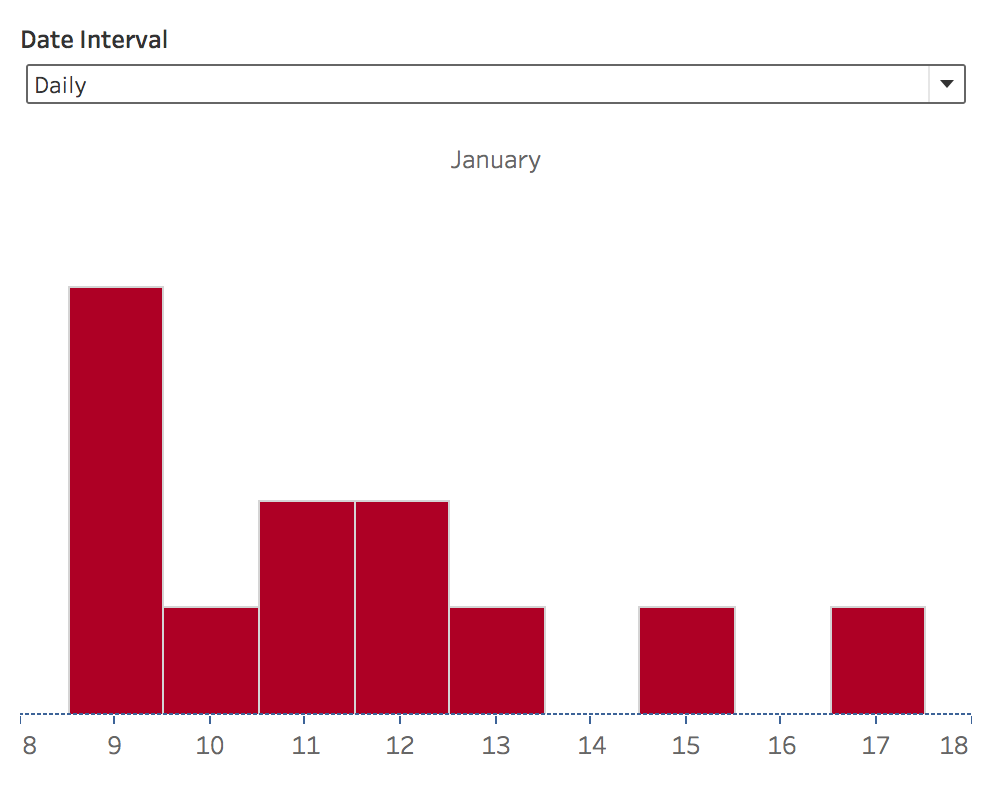
Add the daily chart in a dashboard and also the parameter called interval. Make sure it is selected as daily.
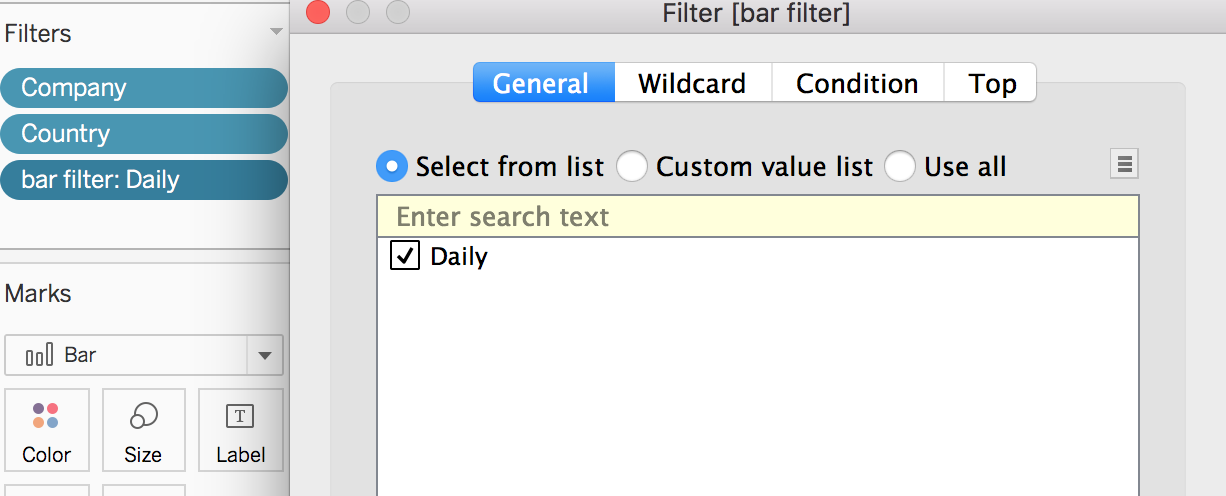
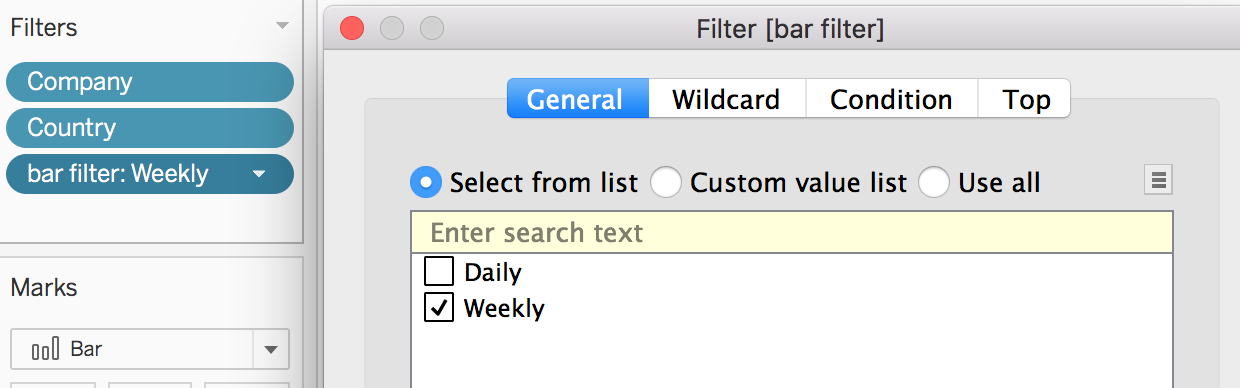
Pass the calculated field into filters and select ‘Daily’ at the Daily Barchart worksheet.
Now select ‘Weekly’ in the parameter, and at the Weekly Barchart worksheet, pass the calculated field into filters, and select ‘Weekly’.
Lastly, add a vertical object into the Dashboard, and add both views into the object.
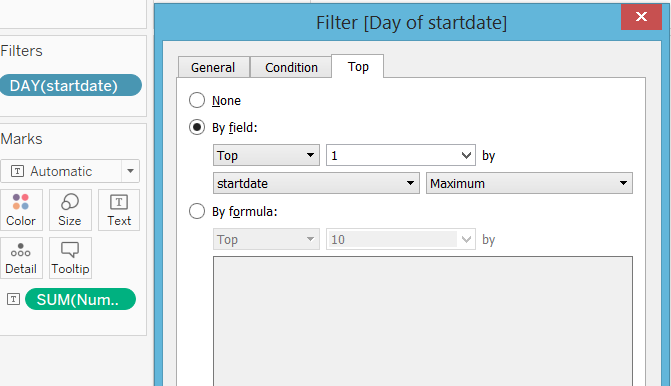
Filter Last Date
How do you only show data from the most recent date? This trick is sourced from http://kb.tableau.com/articles/howto/filter-on-last-date-in-the-data-source. It is achieved from the filter pop-up > Top tab.
Top Bottom N
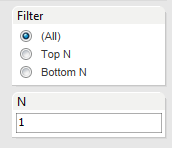
This trick is to have two parameters, one having an option of filtering Top N & Bottom N, or show (All).
The discussion is in this link.
First create these two parameters.
Second, create a new field that aligns the field of interest in ascending order.
rank([Speed],'asc')
Last, create a logic for linking to the two parameters
IF [Filter] = '(All)'
THEN TRUE
ELSEIF [Filter] = 'Top N' AND [rank] <= [N]
THEN TRUE
ELSEIF [Filter] = 'Bottom N'
    # reverses the values of your rank field so that you can select bottom N
    # using the same calculation that works for top N
    AND ((([rank] - WINDOW_MAX([rank])) *-1) +1) <= [N]
THEN TRUE
ELSE FALSE END