Profiling
After detecting potential issues, we will need to profile the code to see how to can resolve or improve on the issue.
Jake VanderPlas provides an excellent description on how to do it using magic commands in jupyter notebooks.
Latency Profiler
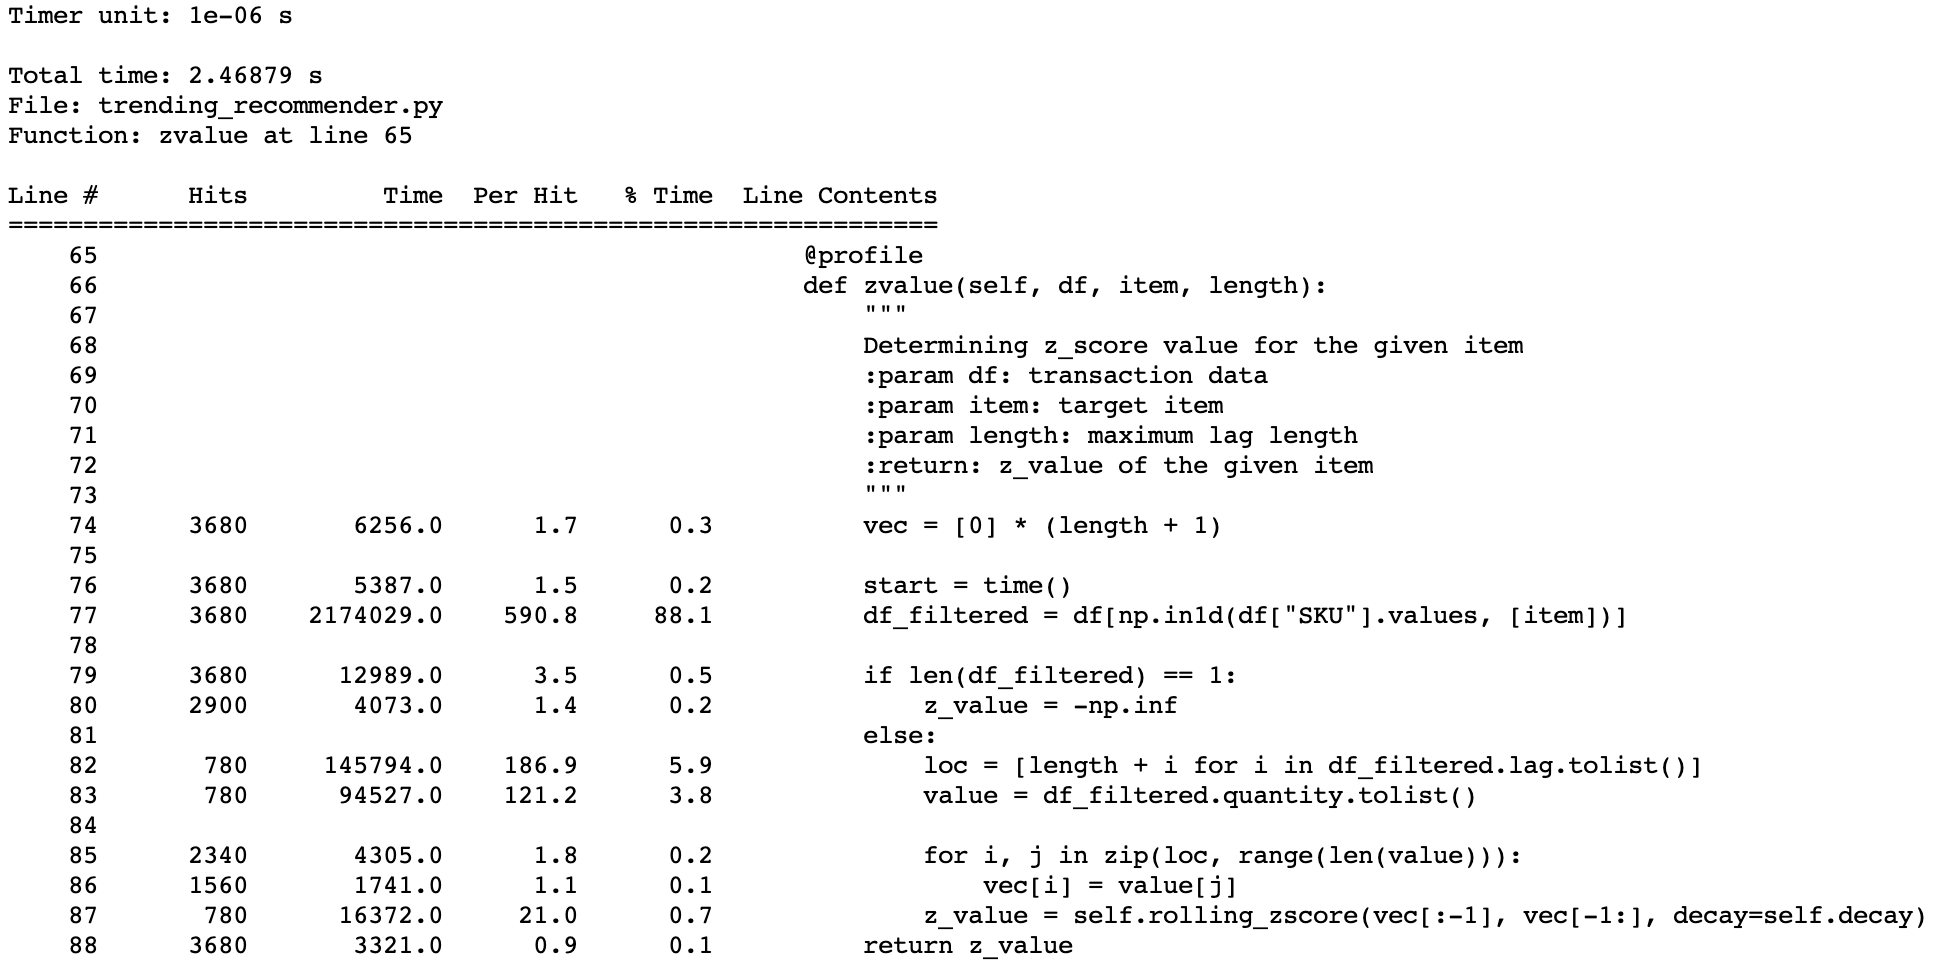
If the latency is not up to par, we can profile our code to identify bottlenecks in the latency line by line. This is done using the library line-profiler. To install, pip install line_profiler
To use the library, we first add the decorator @profile to the functions or methods you want to analyse.
@profile
def zvalue(self, df, item, length):
    vec = [0] * (length + 1)

    start = time()
    df_filtered = df[np.in1d(df["SKU"].values, [item])]

    if len(df_filtered) == 1:
        z_value = -np.inf
    else:
        loc = [length + i for i in df_filtered.lag.tolist()]
        value = df_filtered.quantity.tolist()

        for i, j in zip(loc, range(len(value))):
            vec[i] = value[j]
        z_value = self.rolling_zscore(vec[:-1], vec[-1:], decay=self.decay)
    return z_value
Then we create the report by using the kernprof -l command; a .lprof report is generated. Following which, we view the report with the python -m line_profiler command.
kernprof -l <script_name>.py
python -m line_profiler <script_name>.py.lprof

Memory Profiler
Another libray that works similarly but for memory is memory_profiler. Same as before, we just need to add @profile at the function or method, followed by the command python -m memory_profiler <script>.py
This will generate a report in the terminal as shown. For variables that consume a lot of memory, but are not required downstream, we can delete it via del <variable-name>.
Line #    Mem usage    Increment  Occurences   Line Contents
============================================================
    12   76.180 MiB   76.180 MiB           1   @profile
    13                                         def load_model(config):
    14   76.180 MiB    0.000 MiB           1       api_model_name = os.path.join(config.modeldir, config.model_name)
    15
    16  230.598 MiB  154.418 MiB           1       model = pickle.load(open(api_model_name, "rb"))
    17  230.598 MiB    0.000 MiB           1       if not isinstance(model, dict):
    18                                                 raise ValueError("WARNING: this pickle file at {} is not a dict".format(api_model_name))
    19
    20  319.242 MiB   88.645 MiB           1       predictor = Predict(config.PARAMS[0:5], config.l0, api_model_name)
    21  319.242 MiB    0.000 MiB           1       return predictor
Scalene
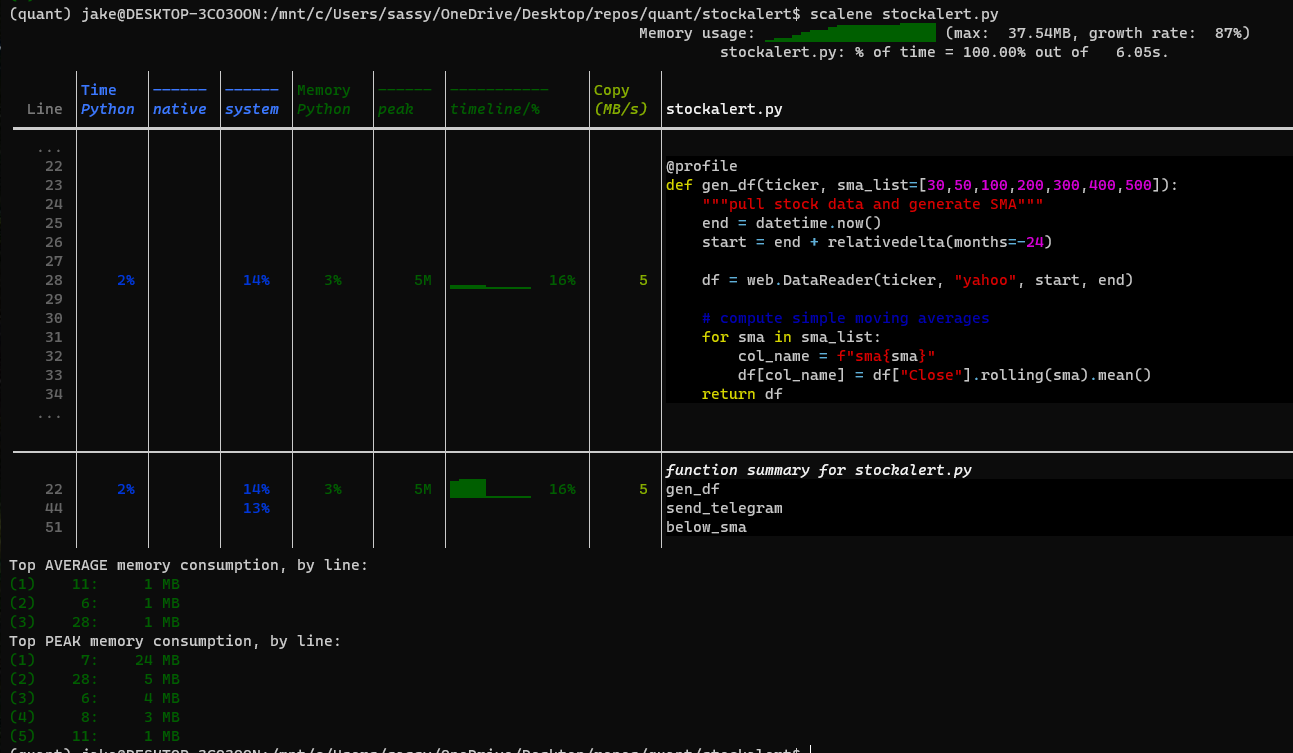
The new kid on the block for profiling is Scalene. It can profile latency, memory of RAM and GPU in a single library.
We either use the usual @profile as mentioned in previous libraries, or use the following code to scan parts or the entirety of a script. We start the profiler using the command scalene <script_name>.py.
from scalene import scalene_profiler

# Turn profiling on
scalene_profiler.start()

# Turn profiling off
scalene_profiler.stop()
The results show both profiling in a single report. However, the latency is shown in percentages, and the memory appears to miss out certain initial RAM usage from library imports.
